


Technologist’s Notes: Tightening the Reigns on Blood Gas Quality Control Reduces Errors
Jeffrey M. Haynes, RRT, RPFT
A critical step in setting up an effective quality control (QC) program is properly establishing acceptable data limits and variance. Levey-Jennings plots are commonly used to graphically record and display blood gas QC data. Data are plotted longitudinally against the mean value and standard deviations (SD).
The mean value is calculated after performing serial measurements. A minimum of 20 measurements should be made; however, collecting more than 20 measurements is desirable.
An SD is simply the average distance from the mean. The empirical rule states that for normally distributed data (Gaussian or bell curve), 95% of data should fall within ± 2 SD of the mean and 99.7% of data should fall within ± 3 SD of the mean. Alternatively, some laboratories choose to use the mean value and ranges provided in the QC material package insert.
In addition to monitoring Levey-Jennings plots and Westgard rules, laboratory personnel should pay attention to the coefficient of variation (CV). CV is easily calculated: (SD ÷ mean) x 100. It is generally accepted that the CV of diagnostic devices should be ≤ 5%.
This article describes an example of a malfunctioning PO2 electrode that eluded detection due to reliance on QC material package insert ranges and lack of attention to the CV.
Figure 1 shows the Levey-Jennings plot of a PO2 electrode prior to the malfunction. It is clear that the mean (X) value derived from the package insert is significantly higher than the mean of measured values.
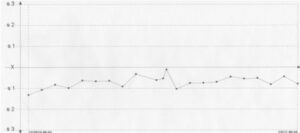
Figure 1. Levey-Jennings plot of a PO2 electrode prior to electrode malfunction. Mean: 54.82 mm Hg; SD: 1.62 mm Hg; CV: 2.95%.
Figure 2 shows a clear change in PO2 accuracy and precision; however, because the blood gas analyzer alert ranges were based on the package insert values, the blood gas analyzer did not categorize these values as out-of-control. In addition, the CV ballooned from 2.95% to 8.16%.
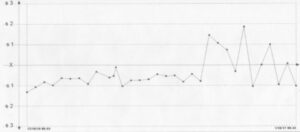
Figure 2. Levey-Jennings plot of a PO2 electrode prior to and after electrode malfunction. Mean: 56.74 mm Hg; SD: 4.63 mm Hg; CV: 8.16%
Figure 3 shows how the mean and 2 SD range should be set according to measured values. If these ranges had been used the blood gas analyzer would have alerted clinicians that an out-of-control condition was present.
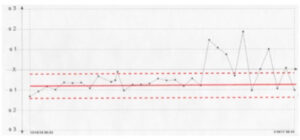
Fig. 3. Levey-Jennings plot of a PO2 electrode prior to and after electrode malfunction. The red solid line represents the true mean of measured values. The dashed red lines represent 2 SD.
Ideally, blood gas QC ranges should be based on measured values, not ranges provided in QC material package inserts. If laboratories choose to use QC ranges from package inserts, they must verify that the measured values fit the ranges. CV should be carefully followed to detect errors in analyzer function.
Highlights of the 2017 ERS/ATS DLCO Guideline
Jeffrey M. Haynes, RRT, RPFT, FAARC
The European Respiratory Society (ERS) and American Thoracic Society (ATS) published a new DLCO guideline in the European Respiratory Journal in January.1 The last ATS/ERS guideline was published back in 2005.2 Some of the new recommendations will be fairly easy for manufacturers and clinicians to implement, while others may be more challenging. This article provides a brief overview of some of the changes in the new guideline.
Calibration and quality
The 3L calibration check of the volume-measuring component of the DLCO system is now 3L±75ml (2.5%), tighter than the current standard for spirometers.3 The preferred DLCO simulation method will be a 3L calibration syringe. The simulation can be performed twice, once with a full syringe of test gas and again with 1L of air mixed with the test gas. This technique will provide a two-point simulation. An acceptable DLCO simulation value is < 0.5 ml/min/mm Hg and the acceptable VA simulation value is 3L±0.3L. Acceptable biologic control values are < 12% of the average value or within 3 ml/min/mm Hg of the average value.
Test methodology
Carbon monoxide and tracer gas concentration are commonly plotted against time; however, the new recommendation is to plot these gas concentrations against volume. DLCO systems will be expected to measure deadspace via Fowler’s technique (as opposed to using fixed estimates). In addition, calculation of alveolar volume should be done with all available exhaled tracer gas.
The 2005 guideline recommends allowing four minutes to elapse between test maneuvers to allow clearing of the test gas from the alveoli. However, the 2017 guideline recognizes that rapid gas analyzers allow technologists to measure exhaled carbon monoxide and tracer gas to determine alveolar clearance. DLCO adjustment for barometric pressure is also recommended.
Acceptability and repeatability
Important changes to acceptability and repeatability criteria have been made. An accepted inspired volume has increased from 85% of the best vital capacity to 90% of the best vital capacity. An inspired volume of 85% will still be deemed acceptable if the alveolar volume is within 200 ml or 5% (whichever is greater) of the largest alveolar volume value from another acceptable maneuver with an inspired volume ≥ 90% of the best vital capacity.
Repeatability criteria continue to require at least two acceptable maneuvers; however, the variability is now 2 ml/min/mm Hg, tighter than the previous recommendation of 3 ml/min/mm Hg.2 A test quality grading system has been developed as depicted in the table below.
Table 1. DLCO Test Quality Scoring System
Score VI/VC BHTIME Sample Time
A ≥ 90%* 8-12 s ≤ 4 s
B ≥ 85% 8-12 s ≤ 4 s
C ≥ 80% 8-12 s ≤ 5 s
D ≤ 80% < 8 or > 12 s ≤ 5 s
F ≤ 80% < 8 or > 12 s > 5 s
*or VI ≥ 85% of the largest VC and the VA is within 200 ml or 5% (whichever is greater) of the largest VA from other acceptable maneuvers. VI = inspired volume; VC = vital capacity; BHTIME = breath hold time; VA = alveolar volume.
Technologists can read the complete ERS/ATS guideline1 free of cost on the European Respiratory Journal website.
References
- Graham BL, Brusasco V, Burgos F, Cooper BG, Jensen R, Kendrick A, et al. 2017 ERS/ATS standards for single-breath carbon monoxide uptake in the lung. Eur Respir J 2017;49:1600016.
- Macintyre N, Crapo RO, Viegi G, Johnson DC, van der Grinten CP, Brusasco V, et al. Standardisation of the single-breath determination of carbon monoxide uptake in the lung. Eur Respir J 2005;26(4):720-735.
- Miller MR, Hankinson J, Brusasco V, Burgos F, Cassaburi R, Coates A, et al. Standardisation of spirometry. Eur Respir J 2005;26(2):319-338.
Could This Be More Than Just Asthma?
Jeffrey M. Haynes, RRT, RPFT, FAARC
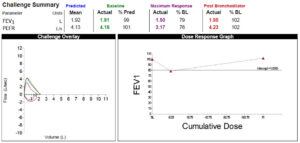
A nine-year-old female underwent a methacholine challenge test because of cough, wheeze, and chest tightness while playing soccer. The result of the methacholine challenge are shown below:
Following the methacholine challenge, the patient was prescribed a bronchodilator and an inhaled corticosteroid. In response the patient enjoyed a marked improvement in symptoms.
Four years later, the patient once again developed “breathing attacks” during soccer. The patient’s asthma therapy was intensified without any improvement in symptoms. Her symptoms became so limiting that she was forced to quit her soccer team. The patient underwent follow-up spirometry, which was completely normal (see flow-volume loop below):
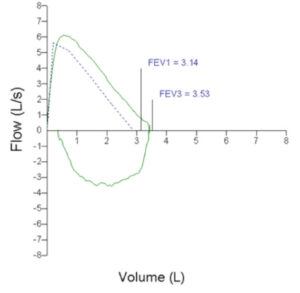
The patient was sent to an asthma and allergy specialist, who referred her for an exercise laryngoscopy to rule out vocal cord dysfunction. The patient rode a cycle ergometer with an ENT scope positioned above the larynx. After the ninth minute of exercise the patient developed stridor and there was clear evidence of vocal cord adduction (see image below).
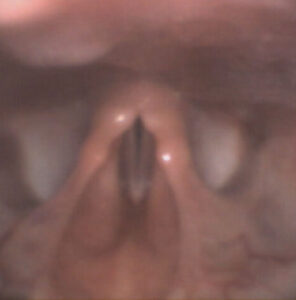
The patient was diagnosed with vocal cord dysfunction and was referred to speech pathology for treatment.
When faced with recalcitrant symptoms, the wise clinician keeps his or her mind open to alternative etiologies, even in the presence of an existing diagnosis.
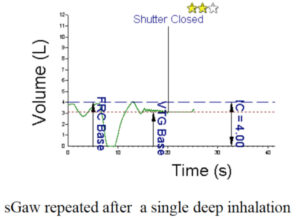
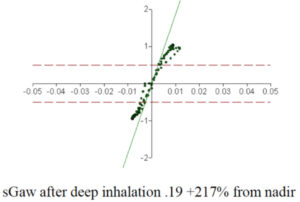
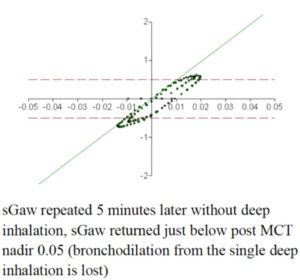
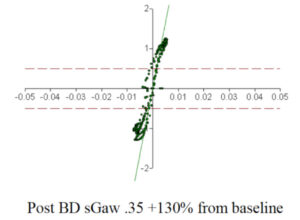
The Power of a Single Deep Inhalation
Jeffrey M. Haynes, RRT, RPFT, FAARC
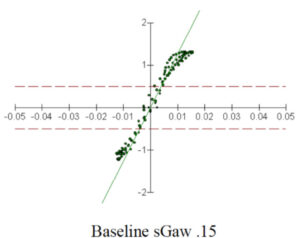
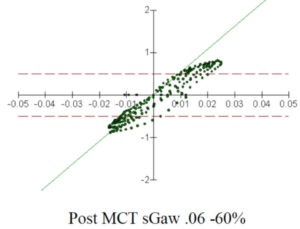
The bronchodilatory and bronchoprotective effect of deep inhalation (DI) has received a lot attention. While not a new concept, experts are now recommending that methacholine challenge tests (MCT) be performed with the tidal breathing method to avoid false negative MCTs in patients with mild airway hyper-responsiveness.1 Indeed, airway stretch has been shown to be a more potent bronchodilator that isoproterenol.2
The figures below illustrate the power of a single deep inhalation in a patient undergoing MCT.
References
- Allen ND, Davis BE, Hurst TS, Cockcroft DW. Difference between dosimeter and tidal breathing methacholine challenge: contributions of dose and deep inspiration bronchoprotection. Chest 2005;128(6):4018-4023.
- Gump A, Haughney L, Fredberg J. Relaxation of activated airway smooth muscle: relative potency of isoproterenol vs. tidal stretch. J Appl Physiol 2001;90(6):2306-2310.
Ask the Expert: Q&A from AARConnect
Jeffrey M. Haynes, RRT, RPFT
A Member Asked:
I am looking for any comments, policies or experiences you all may have with IOS in the adult world. While I also welcome the pediatric perspective, our lab clientele is almost exclusively adult. Why do you perform it? When do you perform it? What resources have you found to help you understand IOS and therefore interpret results? Have you found it useful?
Responses:
Although IOS has received some attention in the pediatric world, there is no reason why it cannot be transitioned to the adult world. The physical interactions between the airways and the pulses of air generated by the IOS are the same regardless of age. The basic physical interaction between the unit and the airways is based on conductance.
In our case, although we are a children’s hospital, we have had success using IOS on older patients who cannot adequately perform spirometry. We have used IOS on teenagers with autism, as well as with kids/teenagers admitted for an asthma exacerbation, because the passive tidal breathing required for this test does not carry with it the same concern for maneuver-induced bronchoconstriction that spirometry does. Ducharme and Davis from Montreal published a nice paper on their use of IOS in the emergency room to gauge bronchodilator response in 1998 for this very reason.
I know that spirometry is considered the gold standard for analysis of asthma control and airways reactivity, but I think IOS has its place, especially among those patients who are unable to perform or should not perform spirometry. Just because it has been examined in children does not mean it should be withheld from the adult population. The most important consideration really becomes finding a physician(s) champion who will embrace the science and apply it as part of their patient care.
Dan Alamillo, BS, RRT-NPS, RPFT
Pulmonary Function Technologist
Children’s Hospital & Research Center
Oakland, CA
One specific area well suited for utilization of oscillometry measures is during exercise bronchoprovocation. Sometimes it is challenging to determine if a patient’s FEV1 indeed dropped after exercise. Is it a lackluster effort or is this decrease in FEV1 real?
Performing IOS prior to spirometry adds confidence in changes seen in FEV1. If FEV1 drops, resistance (R5) and resonant frequency (Fres) should increase. If a bronchodilator is given, you should see the R5 and Fres normalize.
Certainly, resistance by body plethysmography is not going away; we use body plethysmography parameters with methacholine challenges to support changes seen in FEV1 also.
Matthew J. O’Brien, MS, RRT, RPFT, FAARC
Pulmonary Diagnostic Lab-Manager
University of Wisconsin Hospital and Clinics
Madison, WI
Section Connection
Recruit a new member: Know an AARC member who could benefit from section membership? Ask them to call AARC Customer Service at (972) 243-2272 to add section membership to their overall membership package.
Section discussion list: Go to the section website and click on “Discussion List” to start networking with your peers via the AARC’s social networking site, AARConnect.
Next Bulletin deadline: Fall-Winter Issue: Aug. 1, 2017.